Release Notes:
Measure Information Form
Version 2010A1
**NQF-ENDORSED VOLUNTARY CONSENSUS STANDARDS FOR HOSPITAL CARE**Measure Information Form
Measure Set: Perinatal Care(PC)
Set Measure ID: PC-02
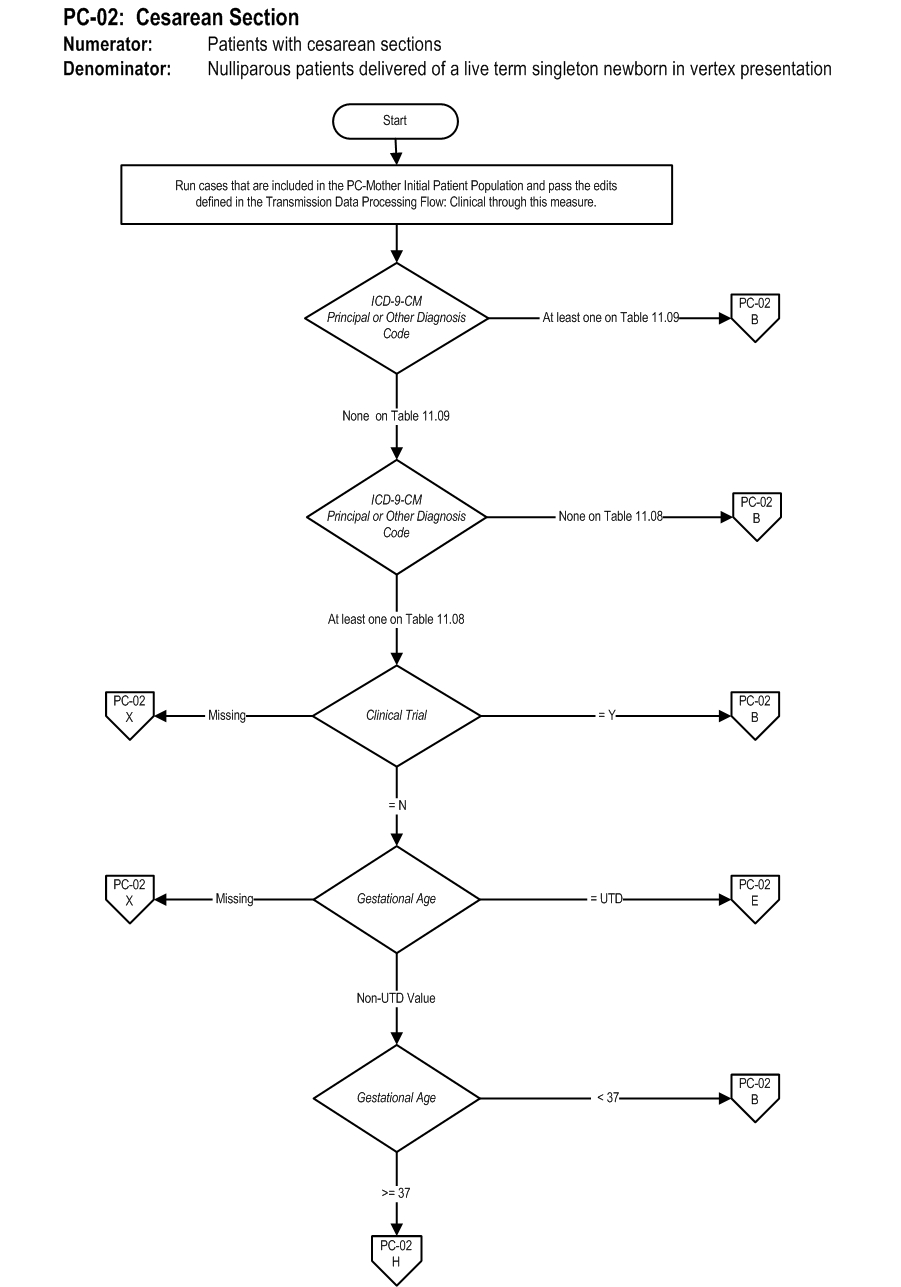
Performance Measure Name: Cesarean Section
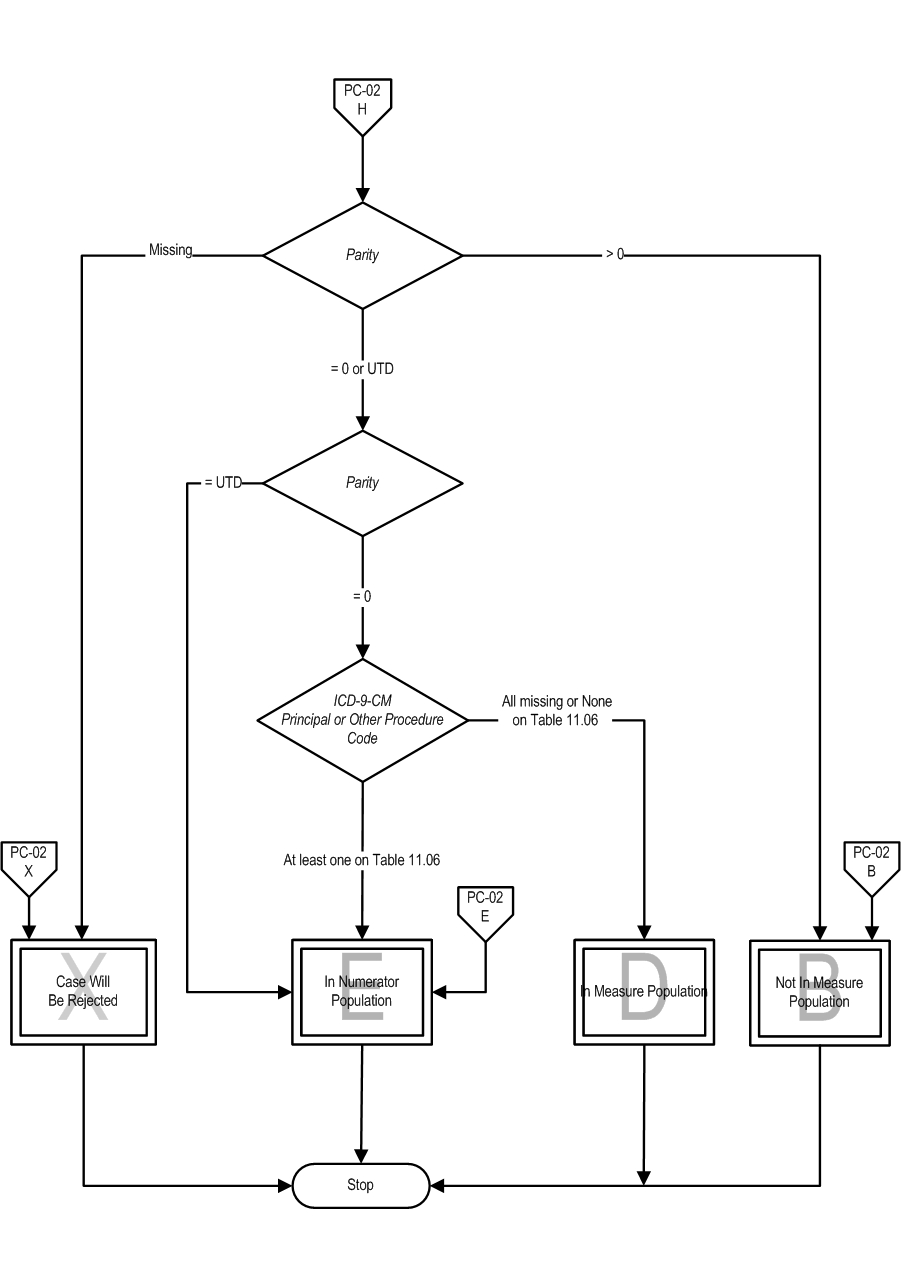
Description: Nulliparous women with a term, singleton baby in a vertex position delivered by cesarean section
Rationale: : The removal of any pressure to not perform a cesarean birth has led to a skyrocketing of hospital, state and national cesarean section (CS) rates. Some hospitals now have CS rates over 50%. Hospitals with CS rates at 15-20% have infant outcomes that are just as good and better maternal outcomes (Gould et al., 2004). There are no data that higher rates improve any outcomes, yet the CS rates continue to rise. This measure seeks to focus attention on the most variable portion of the CS epidemic, the term labor CS in nulliparous women. This population segment accounts for the large majority of the variable portion of the CS rate, and is the area most affected by subjectivity.
As compared to other CS measures, what is different about NTSV CS rate (Low-risk Primary CS in first births) is that there are clear cut quality improvement activities that can be done to address the differences. Main et al. (2006) found that over 60% of the variation among hospitals can be attributed to first birth labor induction rates and first birth early labor admission rates. The results showed if labor was forced when the cervix was not ready the outcomes were poorer. Alfirevic et al. (2004) also showed that labor and delivery guidelines can make a difference in labor outcomes. Many authors have shown that physician factors, rather than patient characteristics or obstetric diagnoses are the major driver for the difference in rates within a hospital (Berkowitz, et al., 1989; Goyert et al., 1989; Luthy et al., 2003). The dramatic variation in NTSV rates seen in all populations studied is striking according to Menacker (2006). Hospitals within a state (Coonrod et al., 2008; California Office of Statewide Hospital Planning and Development [OSHPD], 2007) and physicians within a hospital (Main, 1999) have rates with a 3-5 fold variation.
Type of Measure: Outcome
Improvement Noted As: Decrease in the rate
Numerator Statement: Patients with cesarean sections
Included Populations:
ICD-9-CM Principal Procedure Code or ICD-9-CM Other Procedure Codes for cesarean section as defined in Appendix A, Table 11.06
Excluded Populations: None
Data Elements:
Denominator Statement: Nulliparous patients delivered of a live term singleton newborn in vertex presentation
Included Populations:
Nulliparous patients with ICD-9-CM Principal Diagnosis Code or ICD-9-CM Other Diagnosis Codes for outcome of delivery as defined in Appendix A, Table 11.08 and with a delivery of a newborn with 37 weeks or more of gestation completed
Excluded Populations:
* ICD-9-CM Principal Diagnosis Code or ICD-9-CM Other Diagnosis Codes, for contraindications to vaginal delivery as defined in Appendix A, Table 11.09
- Less than 8 years of age
- Greater than or equal to 65 years of age
- Length of Stay >120 days
- Enrolled in clinical trials
Data Elements:
Continuous Variable Statement:
Included Populations:
Excluded Populations:
Data Elements:
Risk Adjustment: Yes. This section has been moved to the ORYX Risk Adjustment Guide. This guide is available to the public on the Joint Commissions website and, in addition, it is available to performance measurement systems via the Joint Commissions extranet site for measurement systems (PET)
Data Elements
Data Collection Approach: Retrospective data sources for required data elements include administrative data and medical records.
Data Accuracy: Variation may exist in the assignment of ICD-9-CM codes; therefore, coding practices may require evaluation to ensure consistency.
Measure Analysis Suggestions: In order to identify areas for improvement, hospitals may want to review results based on specific ICD-9 codes or patient populations. Data could then be analyzed further determine specific patterns or trends to help reduce cesarean sections.
Sampling: Yes. For additional information see the Sampling Section.
Data Reported As: Aggregate rate generated from count data reported as a proportion.
Selected References:
- Agency for Healthcare Research and Quality. (2002). AHRQ Quality IndicatorsGuide to Inpatient Quality Indicators: Quality of Care in HospitalsVolume, Mortality, and Utilization. Revision 4 (December 22, 2004). AHRQ Pub. No. 02-RO204.
- Alfirevic, Z., Edwards, G., & Platt, M.J. (2004). The impact of delivery suite guidelines on intrapartum care in standard primigravida. Eur J Obstet Gynecol Reprod Biol.115:28-31.
- American College of Obstetricians and Gynecologists. (2000). Task Force on Cesarean Delivery Rates. Evaluation of Cesarean Delivery. (Developed under the direction of the Task Force on Cesarean Delivery Rates, Roger K. Freeman, MD, Chair, Arnold W. Cohen, MD, Richard Depp III, MD, Fredric D. Frigoletto Jr, MD, Gary D.V. Hankins, MD, Ellice Lieberman, MD, DrPH, M. Kathryn Menard, MD, David A. Nagey, MD, Carol W. Saffold, MD, Lisa Sams, RNC, MSN and ACOG Staff: Stanley Zinberg, MD, MS, Debra A. Hawks, MPH, and Elizabeth Steele).
- Bailit, J.L., Garrett, J.M., Miller, W.C., McMahon, M.J., & Cefalo, R.C. (2002). Hospital primary cesarean delivery rates and the risk of poor neonatal outcomes. Am J Obstet Gynecol. 187(3):721-7.
- Bailit, J. & Garrett, J. (2003). Comparison of risk-adjustment methodologies. Am J Obstet Gynecol.102:45-51. * Bailit, J.L., Love, T.E., & Dawson, N.V. (2006). Quality of obstetric care and risk-adjusted primary cesarean delivery rates. Am J Obstet Gynecol.194:402.
- Bailit, J.L. (2007). Measuring the quality of inpatient obstetrical care. Ob Gyn Sur. 62:207-213.
- Berkowitz, G.S., Fiarman, G.S., Mojica, M.A., et al. (1989). Effect of physician characteristics on the cesarean birth rate. Am J Obstet Gynecol. 161:146-9.
- California Office of Statewide Hospital Planning and Development. (2006). Utilization Rates for Selected Medical Procedures in California Hospitals, Retrieved from the Internet on November 1, 2007 at: http://www.oshpd.state.ca.us/Charts/VolUtil/2006Util.pdf.
- Cleary, R., Beard, R.W., Chapple, J., Coles, J., Griffin, M., & Joffe, M. (1996). The standard primipara as a basis for inter-unit comparisons of maternity care. Br J Obstet Gynecol. 103:223-9.
- Coonrod, D.V., Drachman, D., Hobson, P., & Manriquez, M. (2008). Nulliparous term singleton vertex cesarean delivery rates: institutional and individual level predictors. Am J Obstet Gynecol. 694-696.
- DiGiuseppe, D.L., Aron, D.C., Payne, S.M., Snow, R.J., Dieker, L., & Rosenthal, G.E. (2001). Risk adjusting cesarean delivery rates: a comparison of hospital profiles based on medical record and birth certificate data. Health Serv Res.36:959-77.
- Gould, J., Danielson, B., Korst, L., Phibbs, R., Chance, K.,& Main, E.K., et al. (2004). Cesarean delivery rate and neonatal morbidity in a low-risk population. Am J Obstet Gynecol, 104:11-19.
- Goyert, G.L., Bottoms, F.S., Treadwell, M.C., et al. (1989). The physician factor in cesarean birth rates. N Engl J Med.320:706-9.
- Le Ray, C., Carayol, M., Zeitlin, J., Berat, G., & Goffinet, F. (2006). Level of perinatal care of the maternity unit and rate of cesarean in low-risk nulliparas. Am J Obstet Gynecol. 107:1269-77.
- Luthy, D.A., Malmgren, J.A., Zingheim, R.W., & Leininger, C.J. (2003). Physician contribution to a cesarean delivery risk model. Am J Obstet Gynecol.188:1579-85.
- Main, E.K. (1999). Reducing cesarean birth rates with data-driven quality improvement activities. Peds. 103: 374-383.
- Main E.K., Bloomfield, L., & Hunt, G. (2004). Development of a large-scale obstetric quality-improvement program that focused on the nulliparous patient at term. Am J Obstet Gynecol.190:1747-58.
- Main, E.K., Moore, D., Farrell, B., Schimmel, L.D., Altman, R.J., Abrahams, C., et al., (2006). Is there a useful cesarean birth measure? Assessment of the nulliparous term singleton vertex cesarean birth rate as a tool for obstetric quality improvement. Am J Obstet Gynecol. 194:1644-51.
- Menacker, F. (2005).Trends in cesarean rates for first births and repeat cesarean rates for low-risk women: United States, 1990-2003. Nat Vital Stat Rep. 54(4): 1-5.
- Romano, P.S., Yasmeen, S., Schembri, M.E., Keyzer, J.M., & Gilbert, W.M. (2005). Coding of perineal lacerations and other complications of obstetric care in hospital discharge data. Am J Obstet Gynecol.106:717-25.
- U.S. Department of Health and Human Services. (2000). Healthy People 2010: Understanding and Improving Health. 2nd ed. Washington, DC: U.S. Government Printing Office. Measure 16-9.
- Yasmeen, S., Romano, P.S., Schembri, M.E., Keyzer, J.M., & Gilbert, W.M. (2006). Accuracy of obstetric diagnoses and procedures in hospital discharge data. Am J Obstet Gynecol. 194:992-1001.
Original Performance Measure Source / Developer:
California Maternal Quality Care Collaborative
Measure Algorithm:
 Attach file Attach file
|
Measure Information Form PC-02
Specifications Manual for Joint Commission National Quality Core Measures (2010A1)
Discharges 04-01-10 (2Q10) through 09-30-10 (3Q10)
|
|
|